
Network-based intrusion detection using deep learning technique

The dataset considered for the current research is UNSW-NB155, which has 175,341 records and is also imbalanced with a higher proportion of attack samples than normal traffic. To deal with the problem of class imbalance in the UNSW-NB15 dataset, the Synthetic Minority Oversampling Technique (SMOTE) is used in the pre-processing step. This method artificially increased the minority class by creating new realistic examples of the points that already existed so that the class distribution was balanced before the training of the model. Moreover, binary classification models are used on this dataset to evaluate the different metrics of the model. The binary classification model has two classes: Class 0 for no attack and Class 1 for attack. The dataset selected for training was 70%, and for testing was 30%.
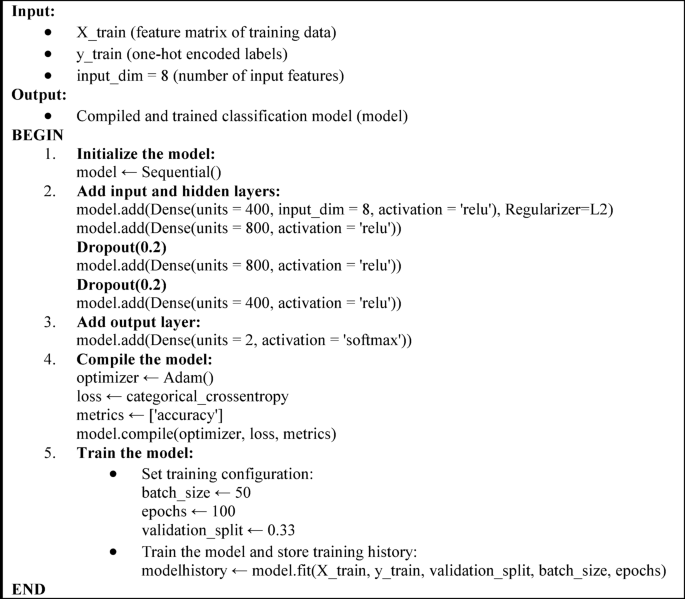
The Pseudo-algorithmic of the proposed model is given below.
After taking the samples, an Extra Tree Classifier, which is a feature selection technique, is applied to different attributes of the dataset. The Extra Tree Classifier was not described in this research as an ordinary classifier but as a strong feature selection method that helped to select the most important features of the UNSW-NB15 data set. Since the dataset provided was of high dimension (43 features), feature reduction was extremely important to make the model not only computation-friendly but also accurate. As the Extra Tree Classifier is an ensemble-based algorithm, it measures the importance of the features against the average decrease in impurity acting upon the selected randomized decision trees. This is in order to weed out the characteristics that have little contribution to the ability to predict the model. The extra tree classifier selected only eight different attributes with the most highly relevant scores where the threshold value 0.021 was selected. All these attributes play a significant role in intrusion detection. As an example, sttl (source to destination time to live) and dttl (destination to source TTL) may indicate an anomaly in packet flow commonly related to spoofing or TTL expiration attacks. Connection-level statistics, such as the features ct_state_ttl and ct_srv_dst, are important to detect advanced patterns of misuse. The selection makes sure that only the most discriminative features are kept, which enhances the computation efficiency without substantial decreases in the accuracy of the model. The scores for this relevancy are summarized in Table 3.
After selecting highly relevant attributes, a standard scalar process is used which scales the selected attributes from the values 0 to 1. After applying the standardization process, the binary classification model is trained with 70% of the training data and 30% of the testing data. The model is trained with 100 epochs and a batch size of 50. As there are 100 epochs to fit the model and a description of all epochs cannot be shown in this limited space, the first five, Table 4, and the last five, Table 5, epochs are shown here.
As depicted in the last two columns of Tables 4 and 5, the trained accuracy (Accuracy) and test accuracy (Val_accuracy) are gradually increasing. While the loss values are decreasing for 0 to 99 epochs, as observed in Tables 4 and 5. The results show the true validation of the model fitting. To further confirm the strength and generalization ability of the proposed Sequential Deep Neural Network (DNN) model, the UNSW-NB15 data set was further subjected to 5-fold cross-validation. The findings revealed a standard deviation of (0.5 +/- ) of the mean classification accuracy of 97.2%, showing that the model performed similarly on different data splits.
The results of binary classification in terms of accuracy, precision, recall, and f1-score are summarized in Table 6.
The table displays the findings taken from various evaluation matrices, which are required to verify the model’s performance. The model performs well in terms of 97.93% accuracy.
The graph of the classification report is presented in Fig. 4.

Graph of classification report.
The classification report metrics of a binary classification problem with precision, recall and F1 score of Class 0 and Class 1. Values are shown for each metric in both classes, and high performance in all metrics is shown for both classes.
Figures 5 and 6 present the learning curve accuracy and their loss drawn from Tables 4 and 5 for the binary classification model. The figure shows that as the no of epoch’s increases, training and testing accuracy increases, and their loss is decreased.
To further validate the results, confusion matrices were used to classify attacks according to binary class, which is shown in Fig. 7.


Plot 4 shows the accuracy of a model during training and testing over 100 epochs. The blue line represents the training accuracy, and the orange line represents the testing accuracy. Both accuracies increase steadily, with the training accuracy reaching a higher value compared to the testing accuracy, which fluctuates somewhat during the training process.
Plot 5 shows the loss of a binary classification model for Network Intrusion Detection Systems (NIDS) over 100 epochs. The blue line represents the training loss, which decreases steadily, while the orange line represents the testing loss, which fluctuates but also tends to decrease. Both losses stabilize towards the end of the training process.
A total of 56,203 test data points were chosen to evaluate the sequential deep learning model. The model correctly predicts 35,666 values for Class 1 and 15,255 values for Class 0. For the understanding of the class distinction, ROC curves of the binary classification model were plotted in Fig. 8. With a variety of threshold values obtained from the probable outcomes of sequential deep learning models, a ROC curve shows the true class rate against the false class rate. The true class rate indicates the likelihood of correctly classifying attacks in contrast to the false class rate, which indicates the possibility of false alarms, which occur when an attack is incorrectly classified.

Confusion matrix for binary classification model.
The confusion matrix shows in Fig. 7 a high number of correct predictions (15255 for class 0 and 35666 for class 1), with relatively fewer misclassifications (1466 false positives and 216 false negatives).Figure 7 shows the model’s performance at identifying normal versus malicious traffic through the ROC curve. A high Area under the Curve value in ROC indicates how well the model detects intrusions. This performance achieves an effective relationship between false negatives (missed attacks) and false positives (flagging legitimate traffic). Manufacturers can incorporate this model into their real-time network monitoring programs that operate in critical industries, including banking and healthcare, to minimize financial and privacy exposure from security breaches. The reliable performance of the ROC curve generates confidence in the operational stability of the system.

ROC curve for binary classification model.
The ROC curve shows the performance of a binary classification model for both classes, with the true class rate plotted against the false class rate. Both Class 0 and Class 1 curves have an area under the curve (AUC) of 0.99, indicating excellent model performance with high true positive rates and low false positive rates.
Comparison with benchmarks
The binary classification models are compared with the benchmark studies6,7,37,38,44,45. Table 7 compares the results of the current study with benchmark cases based on the accuracy score for each model case. The comparison shows that the DNN approach based on the extra tree classifier showed high accuracy in contrast to the other deep learning models.
The comparison of the different models with their accuracy is presented in Fig. 8.
The results of the proposed model, according to Table 7, suggest that the model is the most effective method of intrusion detection. Compared to previous studies (Table 7), the proposed model performed well with the highest accuracy of 97.93% using the DNN model with eight features selected by the Extra Tree Classifier. Moreover, the summarized studies in Table 7 used the sigmoid-based activation function Neural Network Model as compared to the current study, which used the ReLU-based activation function for the DNN model. Hence, the ReLU-based activation function outperforms the other-based activation functions based on the accuracy values.
Discussion
The proposed Sequential Deep Neural Network (DNN) system proved its worth by identifying network intrusions with 97.93% accuracy using a binary classification framework. The model results proved robust and reliable based on precision, recall, and F1-score performance measurement. The approach used in this study shows better performance than Random Forest, LSTM, and ANNs since it uses L2 regularization, dropout, and ReLU activation to solve overfitting and vanishing gradient problems. The model’s performance improved when the Extra Tree Classifier was used to find eight optimal attributes that reduced processing time without dropping accuracy.
The study managed missing data and scaling issues successfully by normalizing essential pre-processing actions. Testing results from confusion matrices and ROC curves reveal the model’s reliability through its high AUC, which demonstrates attack versus normal traffic discrimination. The suggested study showed that the model kept performing better in each training iteration while maintaining stable accuracy and loss trends throughout epochs.
The proposed model shows superior performance through a comparative evaluation against benchmark studies. The existing approach solves the previous limitations of unsuitable class imbalance methods, specialized dataset dependency, and inadequate feature selection criteria. Application of the latest UNSW-NB15 dataset helped make the model more relevant because this dataset provides more accurate representations of actual network traffic behavior than KDD-99.
link


