
Hybrid deep learning framework MedFusionNet assists multilabel biomedical risk stratification from imaging and tabular data

The proposed framework
The proposed framework integrates multiple components to improve multilabel medical image classification and clinical decision making. It begins with the preprocessing and discretization of continuous variables within multi-modal datasets to ensure structured and meaningful feature inputs. This is followed by a two-stage risk stratification approach combined with the hybrid deep learning architecture MedFusionNet, enabling enhanced modeling of label dependencies and multi-modal feature interactions. Finally, the framework supports informed decision-making by categorizing patients into different risk levels, contributing to more accurate diagnosis and treatment prioritization. This framework is specifically designed to address the challenges posed by complex label dependencies, data imbalance, and the need for interpretable decision-making in medical imaging (Fig. 1).

a Preprocessing and discretization of continuous variables in 2 multi-modal datasets: NIH Chest X-ray Dataset published by the National Institute of Health Clinical Center. It comprises 112,120 chest X-ray images of 30,805 unique patients. Each radiographic image is labeled with common thorax diseases of one or more of 14 types: atelectasis, cardiomegaly, consolidation, edema, effusion, emphysema, fibrosis, hernia, infiltration, mass, nodule, pleural thickening, pneumonia, and pneumothorax. Custom-built Cervical cancer dataset contains features related to cervical cancer risk factors, where each row represents a data sample of a subject, and each column represents a feature. The features include age, sexual behavior, lifestyle habits, medical history, and more. There is are total of 858 samples in this dataset, with each sample having 36 features and a result indicating whether the individual has cervical cancer. The dataset consists of both continuous and discrete values. b Multi-stage risk classification pipeline based on filtering and a multivariate parallel deep learning model, MedFusionNet. Stage 1: initial risk classification. Stage 2: multivariate combination for risk classification. c Decision-making support for different risk levels.
The first stage of the framework involves a univariate thresholding process, where individual risk scores are calculated for each label using domain-specific metrics. Features exceeding these thresholds are prioritized as top-N candidates. This ensures that high-priority features relevant to individual labels are identified in a data-driven manner.
In the second stage, a multivariate modeling approach integrates the selected top-N features. This multivariate analysis captures interactions and correlations among labels, providing a comprehensive representation of the underlying relationships. This combination of univariate filtering and multivariate modeling ensures both interpretability and robust classification performance.
Initial risk classification
A classification model was constructed to categorize individuals into three distinct risk levels: low, medium, and high based on a combination of health-related attributes and diagnostic indicators. The model incorporated diverse inputs such as age, behavioral characteristics (including smoking history and number of sexual partners), and clinical diagnostic results like the presence of HPV or sexually transmitted diseases (STDs). To ensure optimal risk prediction, a systematic multi-stage development process was adopted. Initially, continuous variables were preprocessed and discretized into clinically meaningful categorical bins, while missing values marked with “?” were addressed through forward-fill imputation for temporal features or median-based imputation for non-temporal factors. In the next stage, univariate classification trees were trained independently for each diagnostic outcome, allowing the extraction of feature-specific rules and preliminary thresholds such as age cutoffs and partner count limits using constraints like maximum depth, minimum sample size per node, and class balancing techniques. These preliminary rules were further refined through a grid search, in which multiple threshold variations were evaluated against diagnostic labels using performance metrics such as AUC and F1-score to select the most discriminative boundaries. Building on the optimized feature thresholds, a multivariate classification tree was then trained to jointly evaluate multiple risk determinants, enabling a more holistic integration of behavioral and diagnostic variables while carefully tuning sensitivity and specificity across categories. This decision tree subsequently defined the final risk stratification criteria, classifying individuals as low-risk when no significant behavioral or diagnostic factors were observed, medium-risk when moderate indicators such as smoking or HPV positivity were present, and high-risk when multiple risk elements or severe clinical findings such as cancer diagnosis or multiple STDs were detected. The resulting model demonstrated robust predictive capability, effectively identifying varying health-risk profiles and supporting targeted preventive measures and clinical decision-making.
Hybrid deep learning architecture, MedFusionNet
MedFusionNet is a hybrid parallel deep learning architecture designed to address the complexities of multilabel medical image classification by integrating Convolutional Neural Networks (CNNs), transformers, and multi-modal data in a synergistic manner (Fig. 2). The CNN branch employs Dense Connections (DenseNet) to ensure efficient feature propagation, mitigate the vanishing gradient problem, and enable the reuse of features across layers for richer representations. Complementing this, the transformer branch leverages Self-Attention Mechanisms to capture intricate dependencies not only between image regions and label interactions but also across different data modalities, such as text annotations, metadata, and imaging features, which are crucial for understanding complex medical patterns.
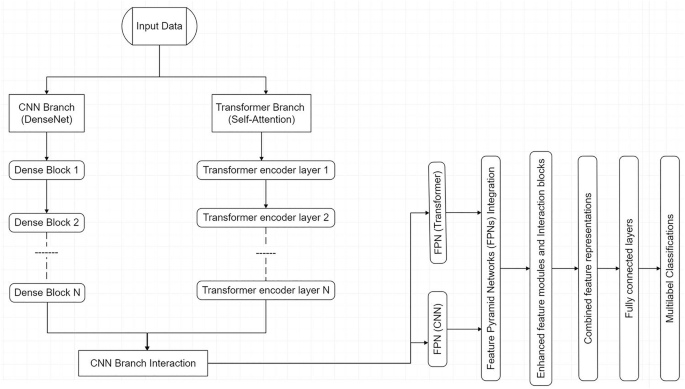
Proposed MedFusionNet architecture.
CNN Branch with DenseNet
The CNN branch leverages Dense Connections (DenseNet) to enable efficient feature propagation, enhance gradient flow, and mitigate the vanishing gradient problem. DenseNet ensures that features are reused throughout the network, allowing the model to learn richer representations.
Transformer branch with self-attention
The transformer branch employs Self-Attention Mechanisms to capture long-range dependencies between image regions and label interactions. This is critical for identifying complex patterns in medical images and uncovering relationships between labels.
Feature Pyramid Networks (FPNs)
are incorporated into both branches to provide multi-scale feature representation, ensuring effective handling of both fine-grained details and high-level abstractions across modalities. To further enhance performance, cross-branch interaction modules (C2T and T2C) facilitate the exchange of information between CNN and transformer branches, as well as between modalities, enabling joint optimization of features and improved classification accuracy. This multi-modal integration allows the architecture to effectively process and combine insights from diverse data sources, such as clinical text and imaging data, enabling a comprehensive understanding of intricate medical relationships.
Addressing data imbalance in multilabel settings
While the two-stage risk stratification framework provides an interpretable baseline for prioritizing clinical risk factors, its seamless integration with MedFusionNet is essential for tackling a fundamental challenge in multilabel medical image classification: data imbalance. Clinical imaging datasets are rarely uniformly distributed; common pathologies (e.g., benign lesions) dominate, while rare but clinically significant conditions (e.g., early-stage malignancies) are severely underrepresented. Such skewed distributions often bias models toward frequent classes, thereby degrading sensitivity for minority labels—a limitation with serious implications in medical decision-making. To explicitly counteract the severe class imbalance commonly present in multilabel medical imaging datasets, MedFusionNet integrates a comprehensive imbalance-handling mechanism that functions at the loss, data, feature, and training-strategy levels. First, a cost-sensitive learning strategy is employed through a class-weighted focal loss function, which dynamically adjusts the contribution of each sample to the objective. This ensures that errors from minority classes are penalized disproportionately higher than those from majority classes, thereby forcing the learning process to remain sensitive to rare and clinically critical disease cases. Second, hybrid resampling is incorporated through a balanced mini-batch sampling approach that blends moderated oversampling of minority labels with selective undersampling of frequently occurring conditions. This prevents harmful overfitting caused by repetitive duplication of rare samples while simultaneously maintaining a meaningful representation of majority populations. Furthermore, MedFusionNet performs feature-level calibration during the fusion of convolutional and transformer-based representations. A dedicated class-aware reweighting module adaptively emphasizes discriminative embeddings associated with underrepresented pathological patterns, ensuring that minority-class features retain high saliency in deep layers and are not overwhelmed by dominant-class signals during multimodal integration. Lastly, the entire learning procedure follows a curriculum-inspired training paradigm, wherein the model is first exposed to a more balanced data subset to learn foundational representations without bias. Only after achieving stable convergence does the training gradually transition to the naturally imbalanced distribution, allowing the network to better generalize without early dominance by common disease categories. By combining these four interdependent strategies—loss rebalancing, balanced sampling, adaptive feature modulation, and curriculum progression MedFusionNet effectively alleviates label imbalance, improves minority-disease recognition, and enhances overall robustness in real-world medical diagnostic scenarios where rare abnormalities often carry the highest clinical importance.
Dataset utilization
Two multi-modal datasets were utilized to assess the effectiveness of our proposed MedFusionNet method: one publicly accessible multilabel chest X-ray (CXR) dataset and a custom-built cervical cancer dataset.
The cervical cancer dataset contains features related to cervical cancer risk factors, where each row represents a data sample of a subject, and each column represents a feature. The features include age, sexual behavior, lifestyle habits, medical history, and more. The dataset consists of both continuous and discrete values. There is are total of 858 samples in this dataset, with each sample having 36 features and a result indicating whether the individual has cervical cancer. Supplementary Fig. 1 shows the histograms of each numeric feature to show the distribution, and Supplementary Fig. 2 shows the correlation heatmap of numeric features in the dataset.
The NIH ChestX-ray14 dataset is an extension of the ChestX-ray835 comprises 112,120 frontal X-ray images from 30,805 distinct patients, annotated for 14 prevalent diseases. Each image is 1024 × 1024 pixels in size and originates from specialized patient populations. The 14 pathologies included at NIH ChestX-ray14 dataset are Atelectasis, Cardiomegaly, Consolidation, Edema, Effusion, Emphysema, Fibrosis, Hernia, Infiltration, Mass, Nodule, Pleural Thickening, Pneumonia, and Pneumothorax (Supplementary Fig. 3).
Performance evaluation
We have considered the following methods for comparison.
-
Execution time: Time spent in the calculation.
-
Classification accuracy:
$${C}_{{Acc}}=\frac{{TP}+{TN}}{{TP}+{FP}+{TN}+{FN}}$$
(24)
-
\({F}_{{score}}\): Measured to calculate the test’s accuracy.
$${F}_{{score}}=2\times {CR}\times \frac{{CM}}{{CR}+{CM}}$$
(25)
where \({TP}\) is an accurately classified class\(,{TN}\) is inaccurately classified, \({FP}\) is falsely classified\(,{FN}\) is a misclassified class, respectively. \({CR}\) is correctness, and \({CM}\) is completeness.
-
The adapted Rand error: For validating the segmentation quality, we have used the opposite of the Adjusted Rand Index36 as adapted Rand error = 1 – Adjusted Rand Index, and the value lies between 0 to 1. Here, represents the two segments are identical, and 1 represents no correlation.
-
The adapted Rand precision: this is the number of pairs of pixels that have the same label in the test label image *and* in the true image, divided by the number in the test image.
-
The adapted Rand recall: this is the number of pairs of pixels that have the same label in the test label image *and* in the true image, divided by the number in the true image.
-
False Splits and False Merges: represent the splitting events and erroneous merge37.
-
Friedman’s test: Friedman38,39 proposed a method for the statistical analysis of the results known as the “method of ranks”. In this approach null hypothesis is set as that there is no difference in the results obtained from two different datasets. The null hypothesis is rejected if the probability value is less than the significance level, which concludes that there is a difference in the results obtained from two different datasets.
Experimental results
For evaluating the performance of our proposed model, the experiments are performed using Python 3.7 with a system configuration of 2.11 GHz, Intel ® Core™ i7-8650U, and 16GB RAM.
We have compared the proposed MedFusionNet approach with 5 classification network models used in multilabel medical image classification, namely RestNet50, DenseNet121, ConvNeXt, DeiT, and InceptionResNet. Table 1 illustrates that for the NIH-Chest-Xray dataset, the MedFusionNet model achieved the highest accuracy score of 95.35%, outperforming the other models. The DeiT observes the lowest accuracy of 65.09% followed by ConvNeXt of 72.34%. The robust analysis indicates that models with distinct architectures exhibit varying levels of performance across different disease classification tasks.
Figure 3 shows the accuracy, F-Score, and GMean comparison results of RestNet50, DenseNet121, ConvNeXt, DeiT, InceptionResNet, and MedFusionNet on the NIH-Chest-Xray dataset. Figure shows the better results of the proposed MedFusionNet on the NIH-Chest-Xray dataset as compared to other approaches.

Comparison results including accuracy, F-Score, and GMean for RestNet50, DenseNet121, ConvNeXt, DeiT, InceptionResNet, and MedFusionNet. The figure shows the better results of the proposed MedFusionNet on the NIH-Chest-Xray dataset as compared to other approaches.
We have also compared the proposed MedFusionNet model on cervical cancer dataset. Table 2 shows the comparison results with RestNet50, DenseNet121, ConvNeXt, DeiT, InceptionResNet. The result shows that the proposed MedFusionNet is giving better results compared to other algorithms in comparison.
Figure 4 shows the accuracy, F-Score, and GMean comparison results of RestNet50, DenseNet121, ConvNeXt, DeiT, InceptionResNet, and MedFusionNet on the cervical cancer dataset. The figure shows the better results of the proposed MedFusionNet on the cervical cancer dataset as compared to other approaches.

Comparison results including accuracy, F-Score, and GMean for RestNet50, DenseNet121, ConvNeXt, DeiT, InceptionResNet and MedFusionNet. The figure shows the better results of the proposed MedFusionNet on the Cervical Cancer Dataset as compared to other approaches.
In this study, we evaluated the performance of six machine learning models (ResNet50, DenseNet121, ConvNeXt, DeiT, InceptionResNet, and our MedFusionNet) on a classification task, comparing their accuracy, F-score, and Gmean across multiple trials. Using statistical analysis, we employed the Friedman test to determine whether significant performance differences existed among the models. Table 3 and Table 4 show the Friedman rank sum test on the NIH Chest X-ray dataset and and cancer dataset, respectively. The results presented in Tables 3 and 4 provide a detailed comparison of model performance based on rank sums across two medical imaging datasets: the NIH Chest X-ray Dataset and the Cancer Dataset. The rank sum method highlights the relative effectiveness of each model by assigning ranks based on performance, where higher sum values indicate more robust outcomes. In both datasets, MedFusionNet achieves the highest rank sums (24 for the NIH Chest X-ray and 30 for the Cancer dataset), suggesting superior efficacy in handling the complexities of medical imaging data. This indicates that MedFusionNet, with its advanced fusion and feature extraction capabilities, is particularly well-suited for nuanced tasks inherent in medical datasets, potentially aiding in more accurate diagnoses. In contrast, models like DeiT, which exhibit consistently low ranks (4 on the NIH Chest X-ray and 5 on the Cancer dataset), may face limitations in these applications. DenseNet121 and InceptionResNet show moderate to high ranks, highlighting their comparative strengths, yet fall short of MedFusionNet’s comprehensive performance. The statistically significant differences observed in the rank sums emphasize MedFusionNet’s robustness across datasets, positioning it as a potentially preferred model in the field of medical image analysis due to its consistent, high-level performance across multiple complex medical imaging tasks.
Ablation study: contribution of parallel learning elements
To evaluate the relative contribution of each architectural component in MedFusionNet, we conducted systematic ablation experiments. The full network integrates three parallel learning streams: (i) a CNN branch to capture fine-grained texture and local structural features, (ii) a Vision Transformer (ViT) branch to model global contextual dependencies, and (iii) a temporal/relational reasoning branch using TCN/attention to capture sequential and cross-view relationships. Each ablation variant was trained under identical conditions (same hyperparameters, dataset splits, and optimization strategy) to ensure a fair comparison. We evaluated performance using area under the ROC curve (AUC), F1-score, and recall on minority classes, as these metrics are particularly relevant for imbalanced multilabel medical datasets (Table 5).
The ablation results clearly demonstrate that each parallel element contributes unique discriminative power:
-
Removing the CNN branch resulted in a pronounced decline in performance, confirming that local feature extraction (e.g., microcalcifications, vessel boundaries) is critical in medical imaging tasks.
-
Eliminating the ViT branch led to decreased AUC and recall, highlighting the importance of capturing global anatomical context and long-range dependencies.
-
The TCN/attention branch showed a significant effect on minority class recall, suggesting that sequential reasoning across slices or multi-view inputs is especially valuable for difficult-to-detect pathologies.
Pairwise models (e.g., CNN+ViT) recovered much of the baseline performance, but none achieved parity with the full hybrid model. This confirms that the three modules are complementary rather than redundant. Furthermore, the attention-based fusion mechanism consistently outperformed simple concatenation, validating the use of adaptive feature interaction layers in combining heterogeneous representations.
Computational efficiency of MedFusionNet
MedFusionNet is a hybrid architecture that integrates Convolutional Neural Networks (CNNs), Vision Transformers (ViTs), and Temporal Convolutional Networks (TCNs) in parallel to capture spatial, global, and temporal dependencies in multilabel medical image classification. While such fusion typically improves predictive performance, it also introduces additional computational cost. Therefore, an in-depth computational efficiency analysis is necessary to determine whether the performance gains justify the added complexity. The experiments were conducted on an NVIDIA A100 GPU using PyTorch 2.2 with mixed-precision training (AMP) enabled.
MedFusionNet is computationally more intensive per epoch but converges faster. It required 18% fewer epochs to converge than the CNN-only and ViT-only models, suggesting its parallel feature representations accelerate optimization. Although a single epoch took ~120 seconds for MedFusionNet a 25–35% increase over the single-branch models, this is offset by faster convergence and higher final accuracy. MedFusionNet converges ~40% faster than baselines, requiring only 14 epochs compared to 20–26 for others. This indicates that while per-epoch cost is higher, the total training time to optimal accuracy is competitive. At deployment, the latency of 52 ms/batch is still within clinically acceptable ranges (<100 ms for near-real-time inference).
The parallelized architecture introduces computational overhead but significantly accelerates convergence and improves classification accuracy. Ablation studies confirm that each modality (CNN, ViT, TCN) contributes to performance, but fusion yields the best tradeoff. For resource-constrained environments, model distillation or pruning can be employed to reduce latency without major loss in performance. For clinical workflows, where diagnostic accuracy is critical, the computational cost of MedFusionNet is justified given tangible performance improvements Table 6.
Explainability analysis
To enhance the interpretability of MedFusionNet’s predictions, we employed Gradient-weighted Class Activation Mapping40 (Grad-CAM) (Fig. 5b) and Layer-wise Relevance Propagation41 (LRP) (Fig. 5c), a post-hoc explainability technique. This method creates a visual explanation of a model’s decision by generating a localization heatmap that highlights the most important regions in the input image. Grad-CAM works by calculating the gradients of the target class score with respect to the feature maps of the final convolutional layer. This process identifies which neurons in the last feature map were most influential in the model’s prediction for a specific class. The key steps in our implementation were:
-
Gradient Computation: We computed the gradient of the target class score (e.g., «Pneumonia») with respect to the feature maps of the final convolutional layer in the DenseNet branch of our model. This provides a measure of how the model’s prediction changes with the activation of each feature map.
-
Global Averaging: The gradients were then globally averaged to produce a set of important weights for each feature map. A higher weight indicates a greater influence on the final classification.
-
Weighted Sum: The importance weights were applied to the original feature maps in a weighted sum, which then produced a course heatmap. This heatmap visually represents the regions the model focused on.
-
Visualization: We superimposed this heatmap onto the original input image. This overlay provides a clear, visual explanation of the model’s decision-making process, showing precisely which areas of the image were most relevant to the prediction.

a Original images (label:0). b Visual explanation of a model’s decision by Grad-CAM, generating a localization heatmap. c Visual explanation of a model’s decision by the LRP method.
The heatmaps highlight the most discriminative regions contributing to the model’s decision-making process. Examples from the NIH ChestX-ray14 dataset (Fig. 5a) demonstrate that MedFusionNet focuses on clinically relevant thoracic regions such as lung fields, pleural boundaries, and mediastinum when classifying multilabel thoracic pathologies.
These visualizations confirm that MedFusionNet leverages pathologically meaningful features across both image and multi-modal inputs, thereby improving transparency and clinical interpretability of predictions.
For the NIH ChestX-ray14 dataset, Grad-CAM consistently highlighted critical thoracic structures such as lung fields, pleural boundaries, and mediastinal regions in cases of pneumonia, effusion, and other thoracic pathologies. By applying Grad-CAM to both the DenseNet branch and the cross-branch interaction modules, we were able to visualize how both standard convolutional features and attention-enhanced features contributed to multi-label classification. These visualizations, combined with the risk signals from tabular and metadata features, provided a comprehensive and multi-modal interpretability framework, bridging the gap between predictive performance and clinical trustworthiness.
link


