


Study design and data sources
Study overview
In this study, we examine the relationship between air pollution and the onset of ACS in Malaysia, focusing on its subtypes ST-Elevation Myocardial Infarction (STEMI) and Non-ST-Elevation Myocardial Infarction/Unstable Angina (NSTEMI/UA). We specifically study key air pollutants like NOx, SO2, O3, and PM10, known contributors to cardiovascular diseases15.
Our analysis leverages ML algorithms, including logistic regression (LR), support vector machine (SVM), random forest (RF), naïve bayes (NB), eXtreme gradient boosting (XGBoost) and stacked EL. The study combines clinical and environmental data to investigate factors influencing mortality in ACS patients, particularly the impact of air pollution. The SHapley Additive exPlanations (SHAP) explainer was used to better understand and improve the predictability and transparency of these models. The study development flowchart is shown in Fig. 1 below.

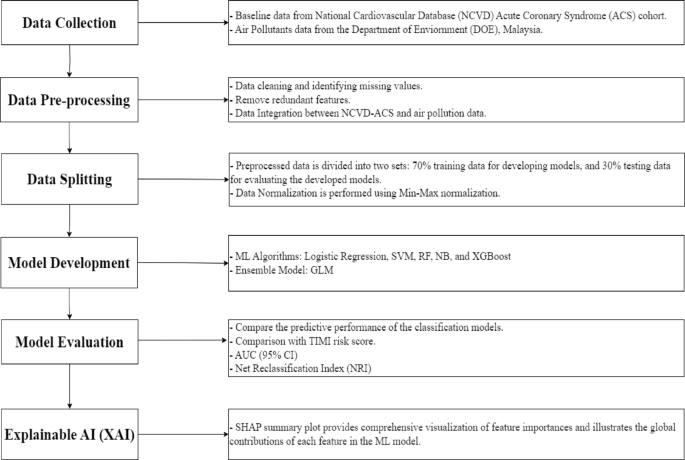
Graphical Workflow of ML Model Development.
Study data
The data for this study was collected from two primary sources: The National Cardiovascular Disease Database (NCVD) for ACS data and the Department of Environment (DOE), Malaysia for air quality measurements. Both datasets were received as structured data.
The NCVD, supported by Malaysia’s Ministry of Health, gathers data on cardiovascular diseases. Our focus is on the NCVD-ACS registry, which includes information from 25 Malaysian hospitals and spans 2006 to 2017. The Medical Review & Ethics Committee (MREC) of the Ministry of Health approved the registry in 2007 (Approval Code: NMRR-07-38-164), with the UiTM ethics committee (Reference number: 600-TNCPI (5/1/6)) and the National Heart Association of Malaysia (NHAM) also granting approval. Key patient data, such as demographics, clinical profiles, and treatment details, are meticulously collected. Patient mortality is verified annually by the National Registration Department of Deaths. The NCVD data was accessed on 9th July 2021. The data used in this study were anonymized prior to analysis, as our research focuses solely on the values and features, without access to any personal information about the patients. All procedures in this study were conducted in accordance with the Declaration of Helsinki. Informed consent was waived by the Medical Review & Ethics Committee (MREC) of the Ministry of Health Malaysia, as the NCVD-ACS data used in this study were anonymized prior to access and analysis.
The study analyzed air quality data from the DOE Malaysia from January 1, 2006, to April 13, 2017, including 61,816 daily measurements of NOx, SO2, O3, and PM10. The DOE air quality data were accessed on 23rd June 2021. This information, which included 24-h mean concentrations from a network of monitoring stations, was combined with NCVD-ACS information from hospitals within a 15-km radius16. Air quality data on time lag 0 aligning with the daily reporting of ACS onset in patient records to assess the impact of air pollution on ACS patients’ mortality risk. Google Earth analysis was instrumental in clarifying the spatial relationships among monitoring stations, hospitals, and air quality. This contributed to better integration of air quality data with NCVD-ACS datasets, ensuring temporal matching of environmental exposure to ACS events.
Outcomes and candidate predictors
The primary outcome of the study was the mortality of ACS patients in relation to air pollution, considering post-ACS onset. It sought to comprehend the impact of air pollution on these mortality rates by investigating the relationship between ACS and air pollution predictors to predict ACS mortality outcomes.
Air pollution exposure assessment and rationale for hospital-based assignment
Recent ISI indexed studies from 2022 to 2025 continue to highlight the relevance of short-term air pollution exposure, particularly to NO2, SO2, and O3, in triggering acute coronary events or influencing mortality outcomes. These findings are especially relevant for Southeast Asia and the Western Pacific. Wang et al.17 conducted a multi-city study in China and found that short-term exposure to PM2.5, NO2, and SO2 was significantly associated with increased hospital admissions for acute myocardial infarction (AMI). He et al.14, in Shanghai, reported that hourly exposure to PM2.5 and NO2 correlated strongly with the onset of AMI, emphasizing the importance of very short-term triggers. Lee et al.18 from South Korea showed that acute exposure to PM2.5 and O3 increased the risk of out-of-hospital cardiac arrest, a severe consequence commonly linked to ACS. In Malaysia, Mohamad Roslan et al.19 investigated cardiovascular admissions in Klang and found that NO2 was significantly associated with ischemic heart disease admissions, especially in interaction with PM10, making it particularly relevant to our study. Similarly, Han et al.20 observed that higher short-term PM2.5 and O3 exposure, coupled with cold weather, was linked to elevated AMI mortality in Taiwan.
Given these findings, this study uses hospital-based air pollution data as a proxy for short-term exposure in ACS patients. The attribution of exposure based on the hospital district rather than patient home addresses was chosen due to practical limitations in accessing individual residential data and the common practice in Malaysia of patients presenting to the nearest tertiary hospital within approximately 100 km of their homes. Although we acknowledge that patients may not always be in their residential or working area at symptom onset, such occurrences are relatively uncommon. The selected approach aligns with established practices in air pollution epidemiology, where hospital or district-level exposure data are often used to estimate ambient conditions during the acute phase preceding hospitalization14,19.
From a methodological standpoint, the choice of exposure assignment in studies of acute events like ACS depends on the hypothesized exposure window and data availability. Residence-based exposure is typically preferred when evaluating long-term or cumulative effects, using pollutant levels from monitors near the home. However, this method does not account for the time patients spend away from home. Conversely, hospital-based exposure, especially in time-series and case-crossover designs, is considered appropriate for short-term exposure studies and has been widely used when fine-scale geolocation data are not available. It reflects the ambient environment where the acute episode likely culminated, particularly when analyzing lag periods of zero to seven days prior to the event. While hybrid or advanced exposure models that incorporate spatio-temporal or personal monitoring data offer improved precision, such approaches are not feasible in large-scale retrospective hospital datasets like ours. Thus, the hospital-based exposure model used here represents a pragmatic and scientifically justified method for evaluating short-term environmental contributions to ACS onset and mortality in the Malaysian context.
Data preparation
Data preprocessing
The source dataset from NVCD registry comprised 54 variables across 54,000 records. For this study, we focused on 14 key input features identified as significant in a previous study by Kasim et al.7. This selection refined the dataset to 14,145 instances, specifically tailored for model development involving ACS patients.
The merged dataset was examined for potential errors, missing values, duplicate records, and outliers. Steps were taken to address these issues systematically: rows with incomplete data or outliers were removed, prioritizing the retention of complete cases. This approach not only improved the dataset’s quality but also minimized the risk of introducing biases or inaccuracies in the ML and stacked EL models, as supported by findings from Psychogyios et al.21.
To address the significant class imbalance inherent in mortality prediction tasks, we employed the Random OverSampling Examples (ROSE) technique during model training. Traditional classifiers often struggle in imbalanced datasets, tending to favor the majority class (survivors) while underperforming on the minority class (mortality), which is clinically the most critical. ROSE generates synthetic examples of the minority class using a smoothed bootstrap approach that estimates the conditional density of the data, thereby creating new instances that are similar but not identical to existing ones. This method enhances model sensitivity and recall for mortality prediction, improves generalizability, and reduces the risk of overfitting associated with simple duplication methods22,23. The effectiveness of ROSE in improving classification performance, particularly for rare outcomes, has been validated in biomedical and clinical informatics research, making it a suitable choice for our ACS mortality dataset.
For missing data, we opted for complete-case analysis by excluding records with missing values in key predictor variables. This approach was chosen to preserve the integrity and interpretability of the model, particularly given the risk of bias introduced by imputation methods when the missingness mechanism is uncertain or potentially not at random. Complete-case analysis provides unbiased parameter estimates when data are Missing Completely At Random (MCAR) and is particularly appropriate when the proportion of missing data is relatively low, as in our dataset24. Moreover, while multiple imputations offer an alternative, it relies heavily on the Missing At Random (MAR) assumption and can result in misestimation or implausible imputations if the imputation model is mis specified25. Given these considerations, the combined use of ROSE for class balancing and complete-case analysis for missing data represents a robust and transparent preprocessing strategy aligned with best practices in clinical prediction modeling.
The detailed breakdown of selected in-hospital variables stratified by survival outcome is provided in Supplementary Table 1. The distribution of variables between the training and testing datasets is summarized in Supplementary Table 2. Performance metrics for each machine learning model—including AUC values, confidence intervals, and statistical comparisons using DeLong’s test—are reported in Supplementary Table 3. The dataset was cleaned and merged with air pollution exposure data from the NCVD Registry and the Department of Environment (DOE), Malaysia, prior to model development and evaluation.
Feature selection in this study was guided by both clinical relevance and findings from our previous work using the same NCVD-ACS registry. In our earlier publication, we developed a validated model to predict in-hospital mortality among ACS patients in Malaysia, using variables routinely collected in the NCVD dataset. These include demographic factors (e.g., age, gender), clinical history (e.g., diabetes, hypertension), vital signs, biochemical parameters, and treatment variables all of which have well-established links to ACS outcomes.
For this study, we extended the feature set by incorporating air pollution variables—NOx, SO2, O3, and PM10—based on data availability from the Department of Environment (DOE) and their documented associations with cardiovascular events in regional studies. Notably, Mohamad Roslan et al.19 demonstrated a strong link between NO2 and ischemic heart disease admissions in Klang, Malaysia. Our approach builds on validated variables from prior model development while introducing regionally relevant environmental predictors, ensuring both methodological continuity and enhanced insight into ACS mortality risk within the Malaysian context.
Data splitting and cross-validation
Data partitioning was depicted in Fig. 2, with 70% allocated for model training and the remaining 30% reserved for validation, following the guidelines in literature26.

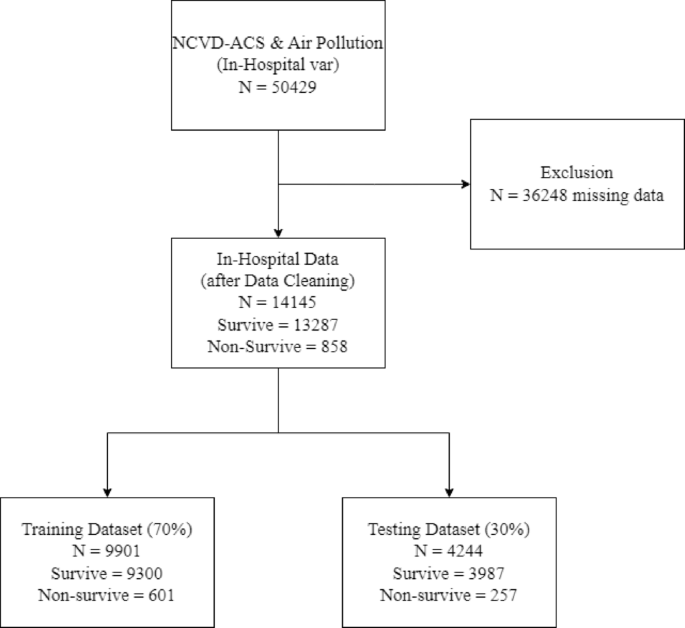
The flowchart indicating the raw number of instances before and after data cleansing in NCVD-ACS and air pollution data for In-Hospital Variables Dataset.
K-fold cross-validation was employed in this study. This technique involves dividing the input data into ‘k’ folds, for instance, k = 5, resulting in the dataset being split into 5 parts. The model undergoes training and evaluation 5 times, using each fold once for testing and the others for training27. This method validates the performance of the developed ML models, ensuring the selection of the best model28.
Data balancing and data normalization
Data imbalance often found in medical datasets where class instances vary, leading to reduced classifier performance and bias towards the majority class29. To predict ACS mortality amid air pollution effectively, we utilized the ROSE method for the training dataset only. ROSE is renowned for its efficacy in binary classification with imbalanced classes. It creates balanced samples for both continuous and categorical data using a smoothed bootstrap approach. This technique maintains the data’s integrity and produces synthetic samples for underrepresented classes, enhancing the accuracy and unbiased of the model23.
For continuous variables such as age, heart rate, high-density lipoprotein (HDLC), low-density lipoprotein (LDLC), fasting blood glucose (FBG), NOx, SO2, O3, and PM10, data normalization was applied using the min–max normalization approach. Previous research has shown that data normalization can significantly improve the accuracy of ML algorithms30.
Machine learning model development
The detailed flow for classification model development presents the sequence of steps in our ML application, including model development, hyper parameter tuning, and the selection of the best-performing model (Fig. 3).

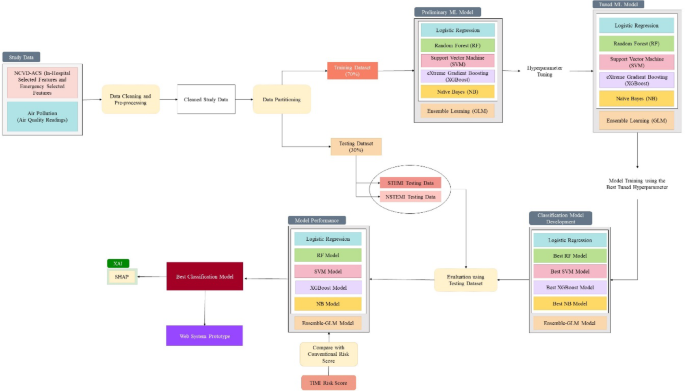
The flowchart of the classification ML predictive models’ development.
Hyperparameter tuning
Each of the models in our study went through hyperparameter tuning, which is critical for optimizing performance and ensuring the accuracy and robustness of our analysis, particularly in the context of air pollution and ACS incidence.
For this purpose, we utilized the ‘caret’ package in R, known for its ability to streamline the training of complex models31. This package was selected for its consistency in delivering outcomes across various model complexities. The hyperparameters values for optimum ML model performance for classification models are included in Supplementary Table 4.
Machine learning performance evaluation
The Area Under the Receiver Operating Characteristic (AUROC) curve is a key metric for evaluating classification models, particularly in medical diagnosis, as noted by Fawcett32. AUROC provides a consistent measure. It assesses a classifier’s ability to distinguish between classes based on true positive and false positive rates, independent of class distributions. This quality makes AUROC a reliable and informative tool for evaluating classifier performance.
The raw testing dataset was used to evaluate the model’s performance without using the ROSE balancing method. This approach was chosen to improve the model’s performance in real-world scenarios.
Model interpretation and comparison
SHAP analysis
To address the ‘black box’ nature of ML algorithms, we used SHAP to interpret ML model predictions33. Utilizing the ‘shap’ library, we computed SHAP values, which provide a unified measure of feature importance. This involved training ML models, making predictions, and then applying the SHAP explainer to these models. SHAP values reveal the contribution of each feature to the predictions, thereby enhancing the global interpretability of the models and understanding of feature importance.
Comparative analysis of ML models and conventional methods: NRI and performance metrics
The Net Reclassification Index (NRI) measures improvement in classifying individuals into higher or lower risk categories when a new model is compared with a pre-existing risk strategy, particularly for the prediction of ACS risk in relation to air pollution34.
The study adopts a mortality risk threshold for high and low-risk patients, as proposed by Correia et al.35, which is applied to the most effective machine learning models for NRI calculation. The determination of suitable cut-off points for the TIMI risk score, particularly for STEMI and NSTEMI/UA patients, is aligned with recognized standards in the field.
The TIMI (Thrombolysis In Myocardial Infarction) risk score was selected as the clinical benchmark in our study due to its widespread use and practicality in in-hospital settings, particularly in Malaysia and other regions within the Western Pacific. Compared to the GRACE score, which incorporates a broader set of variables and is more suitable for long-term risk prediction, TIMI is simpler, additive in structure, and relies on clinical variables that are readily available upon admission making it especially valuable for early triage and mortality risk assessment. Several studies36,37 have shown that the TIMI score performs comparably to GRACE in predicting in-hospital mortality, particularly in acute settings like ST-elevation myocardial infarction (STEMI). Its integration into emergency protocols and ease of bedside use have led to its adoption in national and hospital-level ACS care guidelines. As such, TIMI provides a clinically relevant and contextually appropriate baseline for evaluating the added predictive value of machine learning models for ACS-related in-hospital mortality.
Best model deployment on the web
The best performing algorithm identified in the study, the RF algorithm, has been implemented in an online platform using web programming languages. This web-based system features an interface for mortality prediction, utilizing both ACS and air pollution parameters. Additionally, it incorporates a database for storing patient results, which aids in the ongoing evaluation and enhancement of the system. A reporting mechanism is also integrated, further augmenting its utility in clinical and research settings.
link