


Qualitative comparison of embeddings
We applied PCA, t-SNE, UMAP, and Diffusion Maps to three representative scRNA-seq datasets and visualized the resulting low-dimensional embeddings. Figure 1 shows the projections of cells colored by known cell type annotations.
UMAP and t-SNE produced clear separations between major cell types and preserved local neighborhoods effectively, in line with previous findings10,22. Diffusion Maps captured smooth transitions between cell states, making it especially suitable for inferring cellular trajectories9. PCA, while computationally efficient, failed to reveal complex nonlinear structures in the data17.

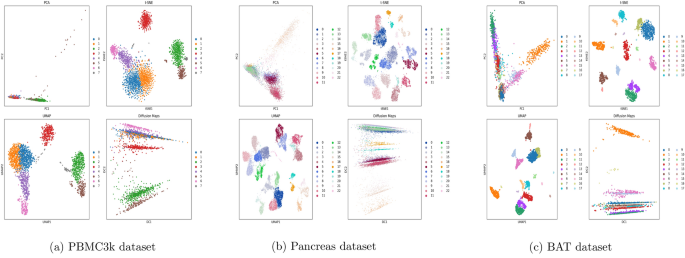
2D embeddings of the scRNA-seq datasets using PCA, t-SNE, UMAP, and Diffusion Maps. Cells are colored by Leiden clusters. All embeddings were computed using the same optimal parameters.
Silhouette scores
To assess clustering fidelity, we computed average Silhouette Scores for each embedding method across the three datasets (PBMC3k, Pancreas, and BAT), as shown in Table 1. UMAP and t-SNE consistently achieved high scores, confirming their ability to maintain intra-cluster compactness and inter-cluster separation. Notably, Diffusion Maps achieved the highest Silhouette Score on the BAT dataset, indicating its strength in capturing complex developmental structures in biologically heterogeneous tissues. These observations are consistent with prior findings that emphasize UMAP’s ability to preserve local neighborhood structure and reflect biological clusters effectively10. The Silhouette Score is sensitive to neighborhood size and the dimensionality of PCA; therefore, we used optimized parameters per dataset to ensure a fair comparison across methods.
Preservation of trajectories
To evaluate the ability of each embedding method to preserve biological trajectories, we visualized pseudotime gradients inferred via the DPT algorithm9 over the low-dimensional spaces generated by PCA, t-SNE, UMAP, and Diffusion Maps. Figure 2 displays the results for three representative scRNA-seq datasets (PBMC3k, Pancreas, and BAT), with cells colored by their pseudotime values.
Among the four methods, UMAP and t-SNE consistently provided smooth and interpretable gradients, capturing continuous developmental transitions and branch structures. Diffusion Maps, as expected, performed well in revealing global pseudotemporal organization, especially in the pancreas and BAT datasets. In contrast, PCA embeddings often showed weak or noisy gradients, indicating limited capacity to preserve nonlinear trajectories.
These findings confirm that nonlinear manifold learning methods are better suited for trajectory inference tasks in single-cell transcriptomics. Our visual analysis aligns with prior studies17,18, and highlights the importance of embedding geometry when interpreting dynamic biological processes.

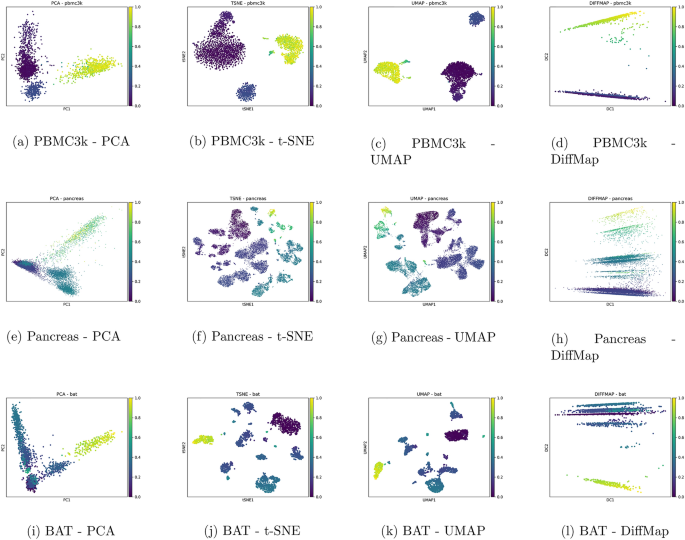
Pseudotime visualization across embedding methods for PBMC3k, Pancreas, and BAT datasets. DPT pseudotime values are projected onto PCA, t-SNE, UMAP, and Diffusion Maps embeddings. UMAP, t-SNE, and Diffusion Maps reveal smooth developmental gradients and branch-like structures, while PCA shows limited trajectory preservation.
Joint evaluation via TAES metric
To integrate the strengths of both clustering quality and trajectory preservation, we propose a composite metric named TAES (Trajectory and Embedding Stability). This metric is defined as the average of the Silhouette Score and the trajectory correlation (based on Spearman correlation between pseudotime and low-dimensional coordinates), providing a unified view of embedding performance across multiple objectives.
We applied this metric to both the PBMC3k, Pancreas, and BAT datasets and evaluated the four major embedding techniques: PCA, t-SNE, UMAP, and Diffusion Maps. The results, presented in Fig. 3 and Table 2, indicate that UMAP and Diffusion Maps generally achieve the highest TAES scores, confirming their superior balance between cluster compactness and pseudotemporal continuity.

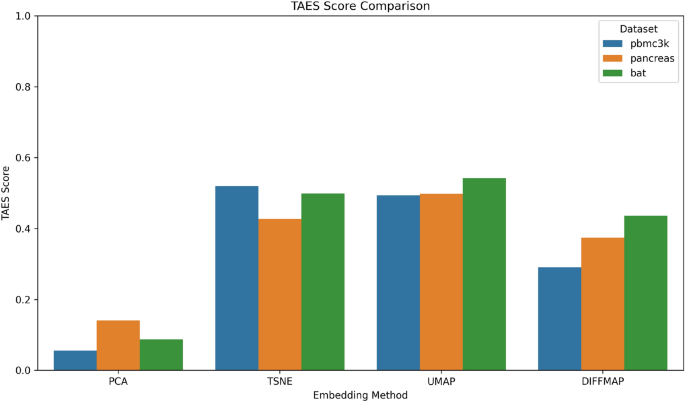
Comparison of TAES scores across embedding methods and datasets. UMAP and t-SNE consistently outperform PCA and Diffusion Maps in achieving both clustering and trajectory preservation.
The strong TAES scores of UMAP and t-SNE suggest their dual utility in both clustering-based annotation and dynamic process analysis. This metric could serve as a practical evaluation tool for selecting embedding algorithms in single-cell studies.
Effect of alternative pseudotime inference methods on TAES
To assess the robustness of the proposed TAES metric with respect to different pseudotime inference algorithms, we evaluated the performance of four embedding methods (PCA, t-SNE, UMAP, and Diffusion Maps) under two widely used pseudotime inference algorithms: Slingshot19 and Monocle320. This analysis was conducted across all three datasets (PBMC3k, Pancreas, and BAT), using the same optimized values of n_pcs and n_neighbors identified previously.
Visual comparison
Figure 4 illustrates TAES scores across different embeddings for both pseudotime algorithms. Despite variations in absolute values, the overall ranking of embeddings remains consistent: UMAP and t-SNE generally achieve higher TAES values across all datasets and pseudotime methods. Diffusion Maps also exhibits competitive performance, especially for the Pancreas and BAT datasets, which are known to contain complex developmental trajectories.

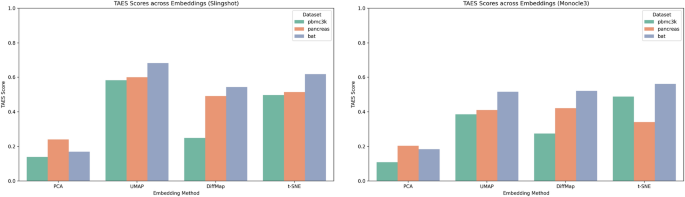
TAES scores for four embeddings under two pseudotime inference methods: Slingshot (left) and Monocle3 (right).
Quantitative comparison
Table 3 summarizes TAES values across embeddings and pseudotime inference methods. While Slingshot often yields higher trajectory correlations-likely due to its curve-fitting approach-the relative rankings among embedding methods remain similar across both algorithms. This pattern underscores the stability of TAES when subjected to variations in the pseudotime estimation technique.
link